Definition
Boxplot
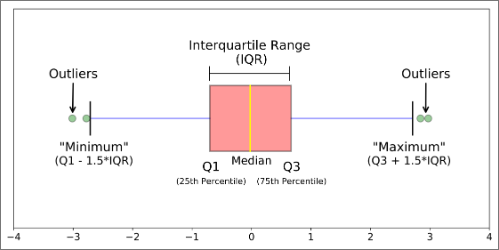
A boxplot, also known as a box-and-whisker plot, is a standardised way of displaying the distribution of data based on a five-number summary: minimum, first quartile, median, third quartile, and maximum. It provides a visual summary of key aspects of the distribution, including central tendency, variability, and skewness.
Visualisation
Terms
Quartile
Quartile (Boxplot)
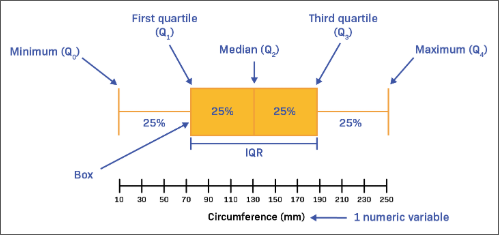
In a boxplot, a quartile refers to a value that divides the data into quarters. The first quartile (Q1) is the median of the lower half of the dataset, the second quartile (Q2) is the overall median, and the third quartile (Q3) is the median of the upper half of the dataset, effectively splitting the data into four equal parts.
Interquartile Range
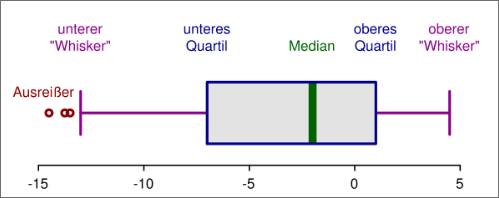
Interquartile Range
School
Exam Question
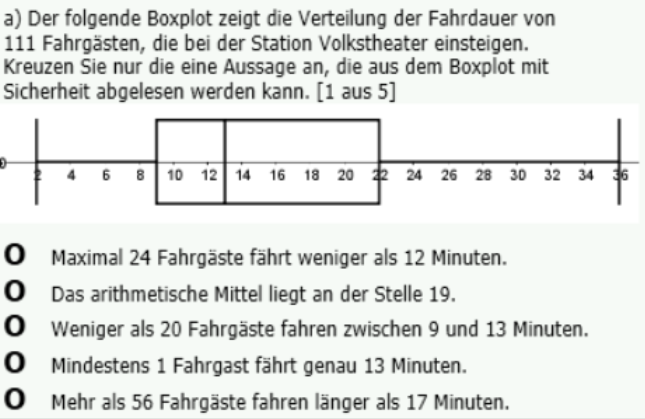
- Interpretation:
- 111 passengers → odd number of passengers → distinguishable median
- minimum travelling time is 2 minutes
- maximum travelling time is 36 minutes
- 25% of passengers travel less or equal to 9 minutes
- the median is 13 minutes
- 50% of passengers travel less or equal to 13 minutes
- 75% of passengers travel less or equal to 22 minutes
- Answer: Mindestens 1 Fahrgast fährt genau 13 Minuten.
- Explanation: Die Anzahl der Fahrgäste ist ungerade (111), dementsprechend gibt es eine genaue Mitte (=1 Fahrgast), welcher durch den Median abgebildet wird. Denn wenn die Anzahl der Fahrgäste gerade wäre, so würde das arithmetische Mittel der in der Mitte liegenden gebildet werden.